Two people in a factory discussing data charts on a laptop screen showing bar and engagement graphs.

Redzone Analytics Software Turns Factory Data Into Real-Time Results

The Redzone manufacturing analytics platform delivers real-time, role-based insights that enable faster decisions, provide strategic insights, and drive measurable performance gains across your entire operation.

Trusted by 2,000+ factories worldwide

to drive productivity and connect frontline teams with AI where the work happens.

Post Consumer Brands
Nestlé Purina
Ventura Foods
Golden State Foods
Lactalis McLelland
Schwan's Company
Tillamook
Taylor Farms

Empower Every Role: Insights for Smarter, Data-Driven Decisions

Build the Reports Your Operation Actually Needs
Get the most from your manufacturing data. CI and site leaders can create custom reports more easily with prepopulated templates, including Report Builder licenses for shared workspaces, clear schemas, and online training.
Web Dashboards For All, Live From Day 1
Everyone gets fast, easy access to powerful reports through browser-based dashboards. Redzone's standard analytics platform includes unlimited users; ready-to-use reports for production, maintenance, and quality teams; and full compatibility across all major browsers.
Seamless Data Integration Across Your Operation
Enable data lake integration, gain multisite visibility through unified views, and run faster queries that turn enterprise data into actionable insights. Understand performance by product, line, and site.

Empower Every Role: Insights for Smarter, Data-Driven Decisions

Top left corner of a device screen showing the time as 5:54 PM and date as Mon Mar 22 with a red curved edge background.
01

Build the Reports Your Operation Actually Needs

Get the most from your manufacturing data. CI and site leaders can create custom reports more easily with prepopulated templates, including Report Builder licenses for shared workspaces, clear schemas, and online training.

Top left corner of a device screen showing the time as 5:54 PM and date as Mon Mar 22 with a red curved edge background.
02

Web Dashboards For All, Live From Day 1

Everyone gets fast, easy access to powerful reports through browser-based dashboards. Redzone's standard analytics platform includes unlimited users; ready-to-use reports for production, maintenance, and quality teams; and full compatibility across all major browsers.

Top left corner of a device screen showing the time as 5:54 PM and date as Mon Mar 22 with a red curved edge background.
03

Seamless Data Integration Across Your Operation

Enable data lake integration, gain multisite visibility through unified views, and run faster queries that turn enterprise data into actionable insights. Understand performance by product, line, and site.

Screen corner of a device showing time 5:54 PM and date Mon Mar 22 on a white background with red accent.Top right corner of a smartphone screen showing full cellular signal, Wi-Fi connected, 100% battery, and battery icon.Dashboard showing US sales and profitability map with blue and orange circles, and line graphs of monthly sales by segment from 2014 to 2017.

From Real-Time Data to Real-World Results

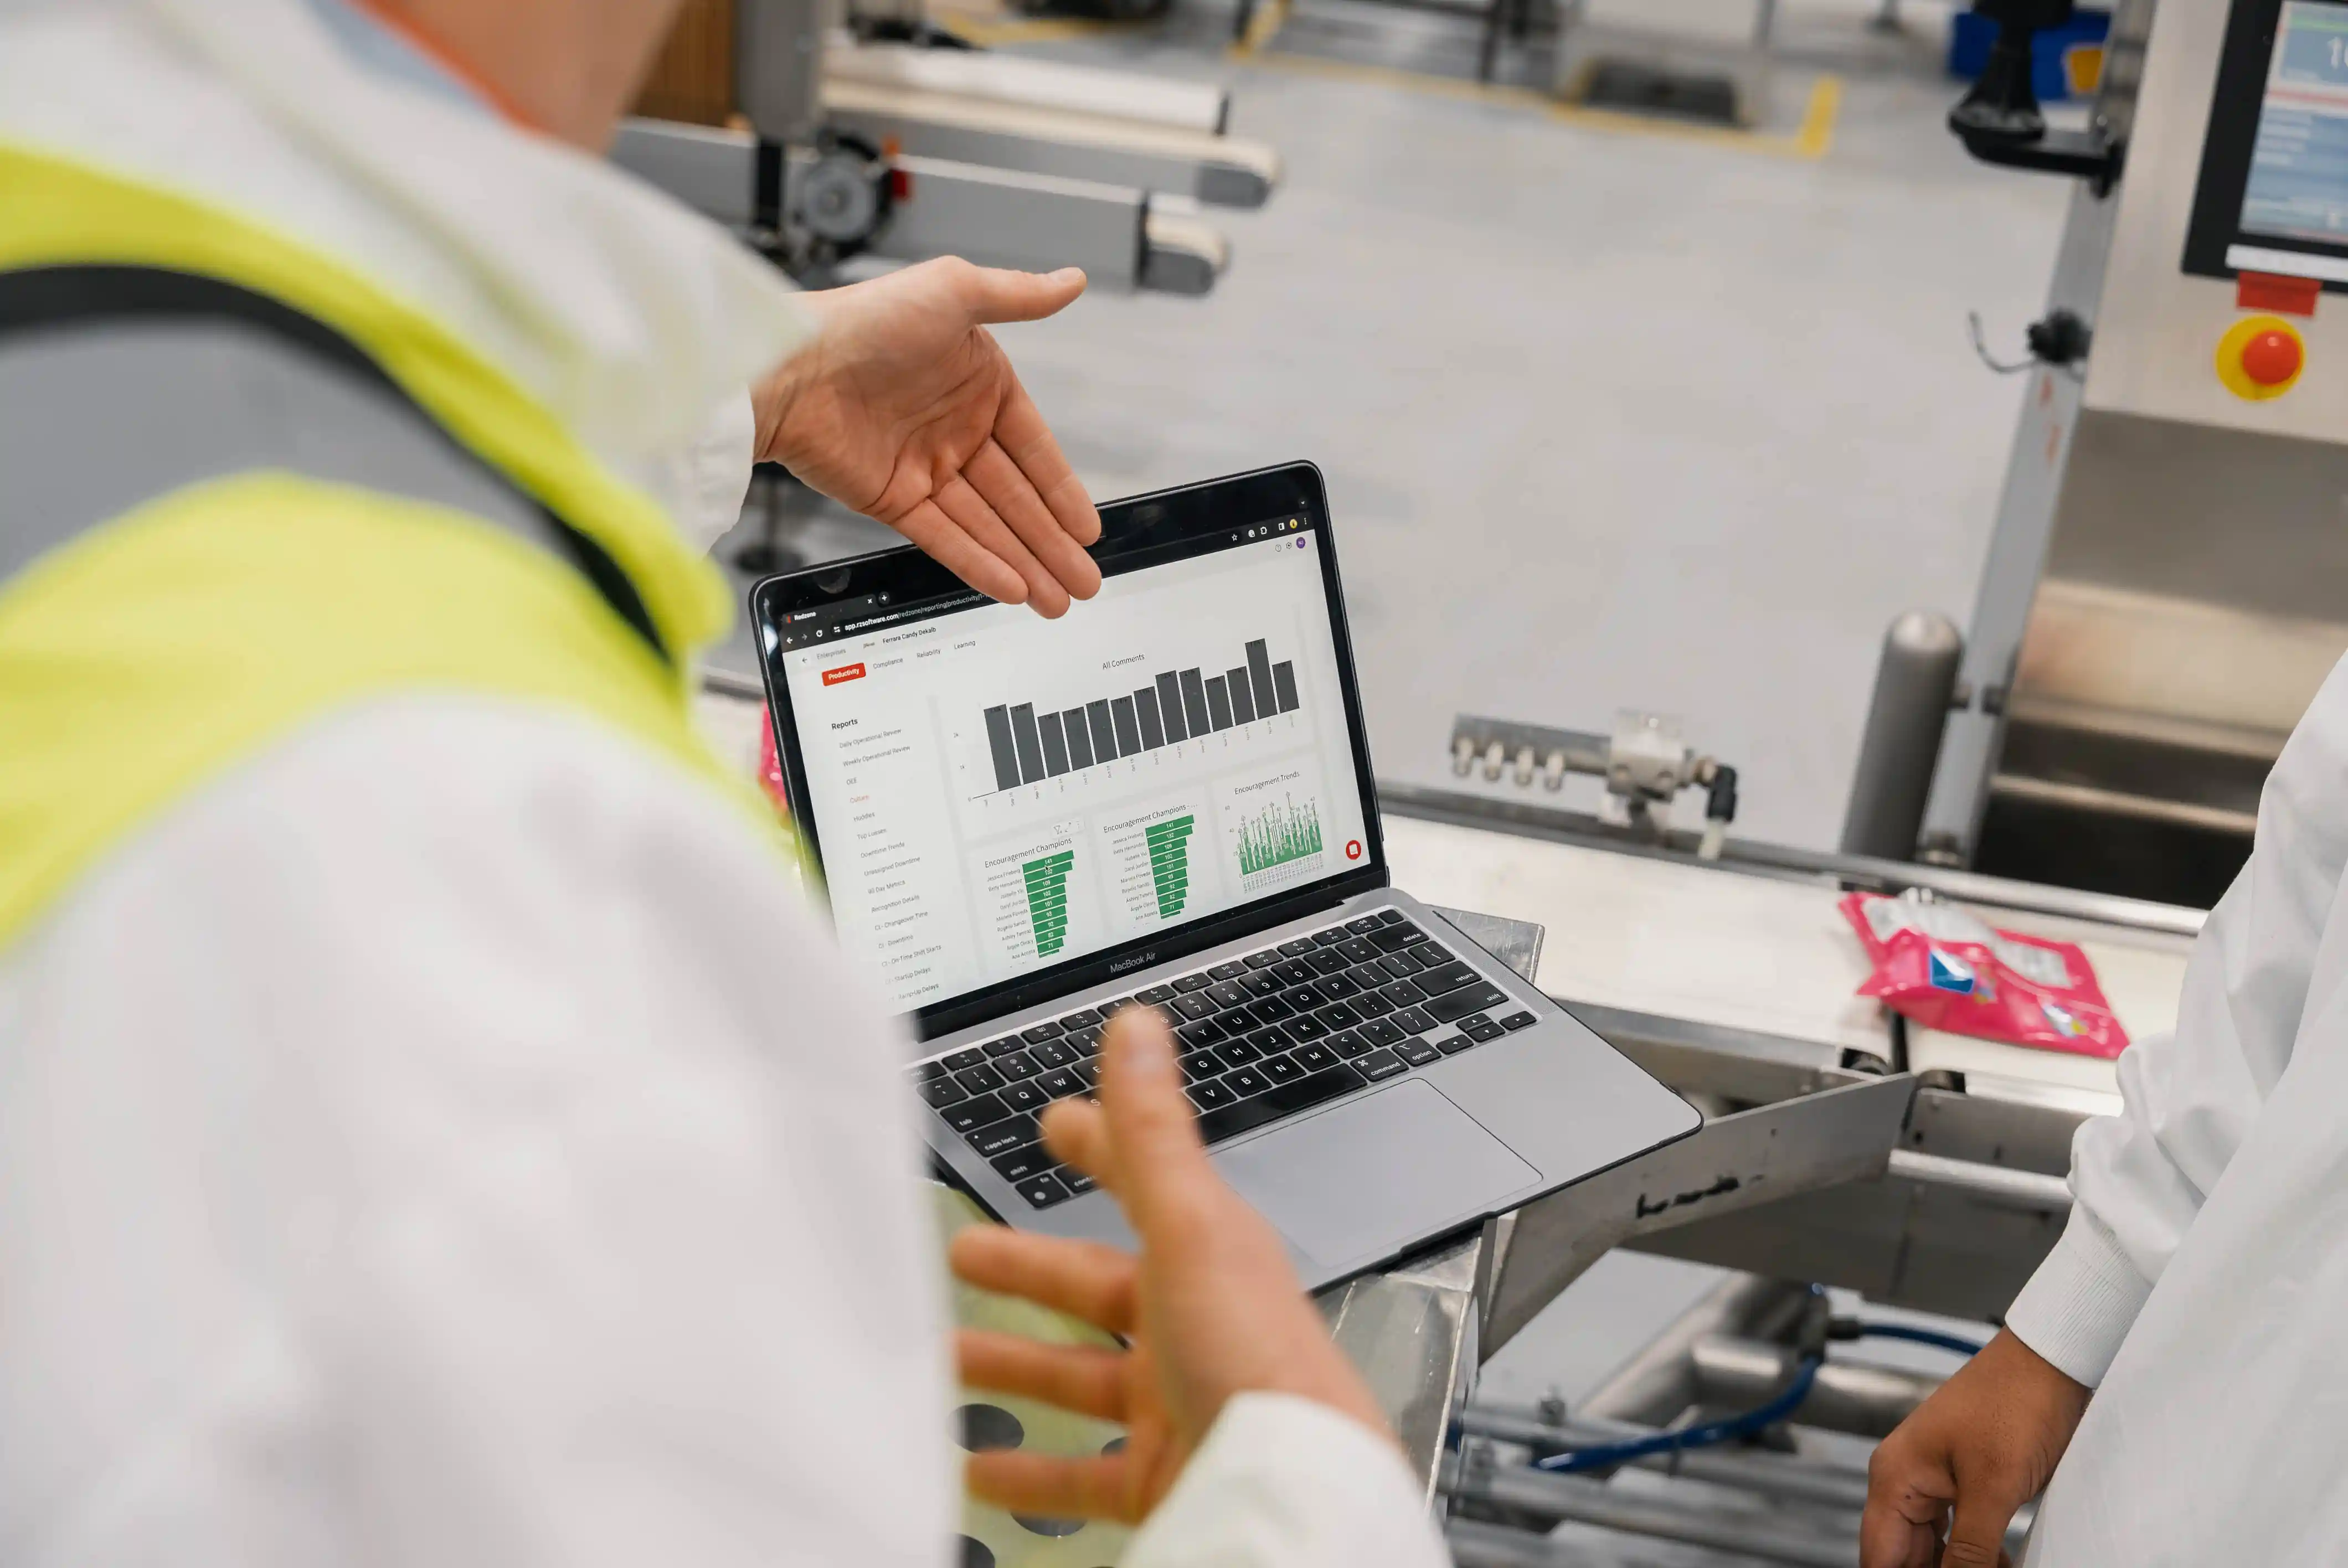
Redzone manufacturing analytics software transforms production history into actionable insights, giving every team instant visibility into throughput, performance, downtime, and quality. This enables teams to prevent issues, improve processes, make strategic decisions, and drive continuous improvement across the entire operation.

"Once you introduce your workforce to Redzone, nobody wants to go back. All the information they need is right there at their fingertips."

Kyle Hach

COO at Raining Rose

"When you're considering QAD Redzone, don't just look at the productivity gains you can achieve with the solution. Look at how your employees are now communicating with each other, across business functions and about business challenges. Employees thrive when they're given the tools to be successful every day."

Meg Post

CEO at Haviland

Frequently Asked Questions

Didn’t find what you need? View the full FAQ.

Can I see production reports in the Redzone app?

Yes, you can see production reports in the Redzone app. These reports are built to fit the mobile platform and answer frontline teams' real-time information requests with intuitive visuals and simplified reports.

I have a lot of data I would like to include. Can I build my own reports?

Yes, you can build unlimited custom reports with data in Redzone Analytics. Because every factory is unique, factory CI teams and leaders can customize reports or build reports from scratch. Manufacturers can even use data lakes to integrate Redzone data with other data sources to create a single, unified reporting system.

Is Redzone Analytics hard to learn?

No, Redzone Analytics is not hard to learn. Basic reports are live on Day 1 of every deployment. Views are built with the frontline operator in mind, with simple filters and web-based reports accessible from any browser. 

What makes Redzone Analytics different from traditional manufacturing dashboards?

Redzone Analytics connects production, maintenance, and quality data in one platform. Data is contextualized by SKU, shift, asset, and team, unlocking deep insights that speed continuous improvement.