Trusted by 2,000+ factories worldwide
to drive productivity and connect frontline teams with AI where the work happens.








Industry Challenges
Unplanned downtime is a major source of lost capacity in manufacturing plants — and one of the hardest to track and understand.
Downtime Logged After the Shift
By the time the supervisor fills out the shift report, context is gone and it's too late to find the root cause of a stoppage.
No Visibility Across Lines
Supervisors can't see which line is struggling until they walk the floor — often minutes or hours too late to help.
Root Causes Repeat
The same machines stop for the same reasons every week because no one has the data to find and fix the real root cause.
Escalation Is Too Slow
Minor stoppages turn into major losses before operations leadership or maintenance is aware.
Redzone's Solution
Redzone connects every layer of the plant — operators, supervisors, and maintenance — into one real-time system, so stoppages are captured, escalated, and resolved faster.
Capture Stoppages in Real Time
Monitor Live OEE Dashboard by Line
Automate Maintenance Escalations
Monitor Root Cause Trends
Run Structured Problem Solving
Who It’s For
Built for the people who can prevent downtime and slowdowns on the floor.
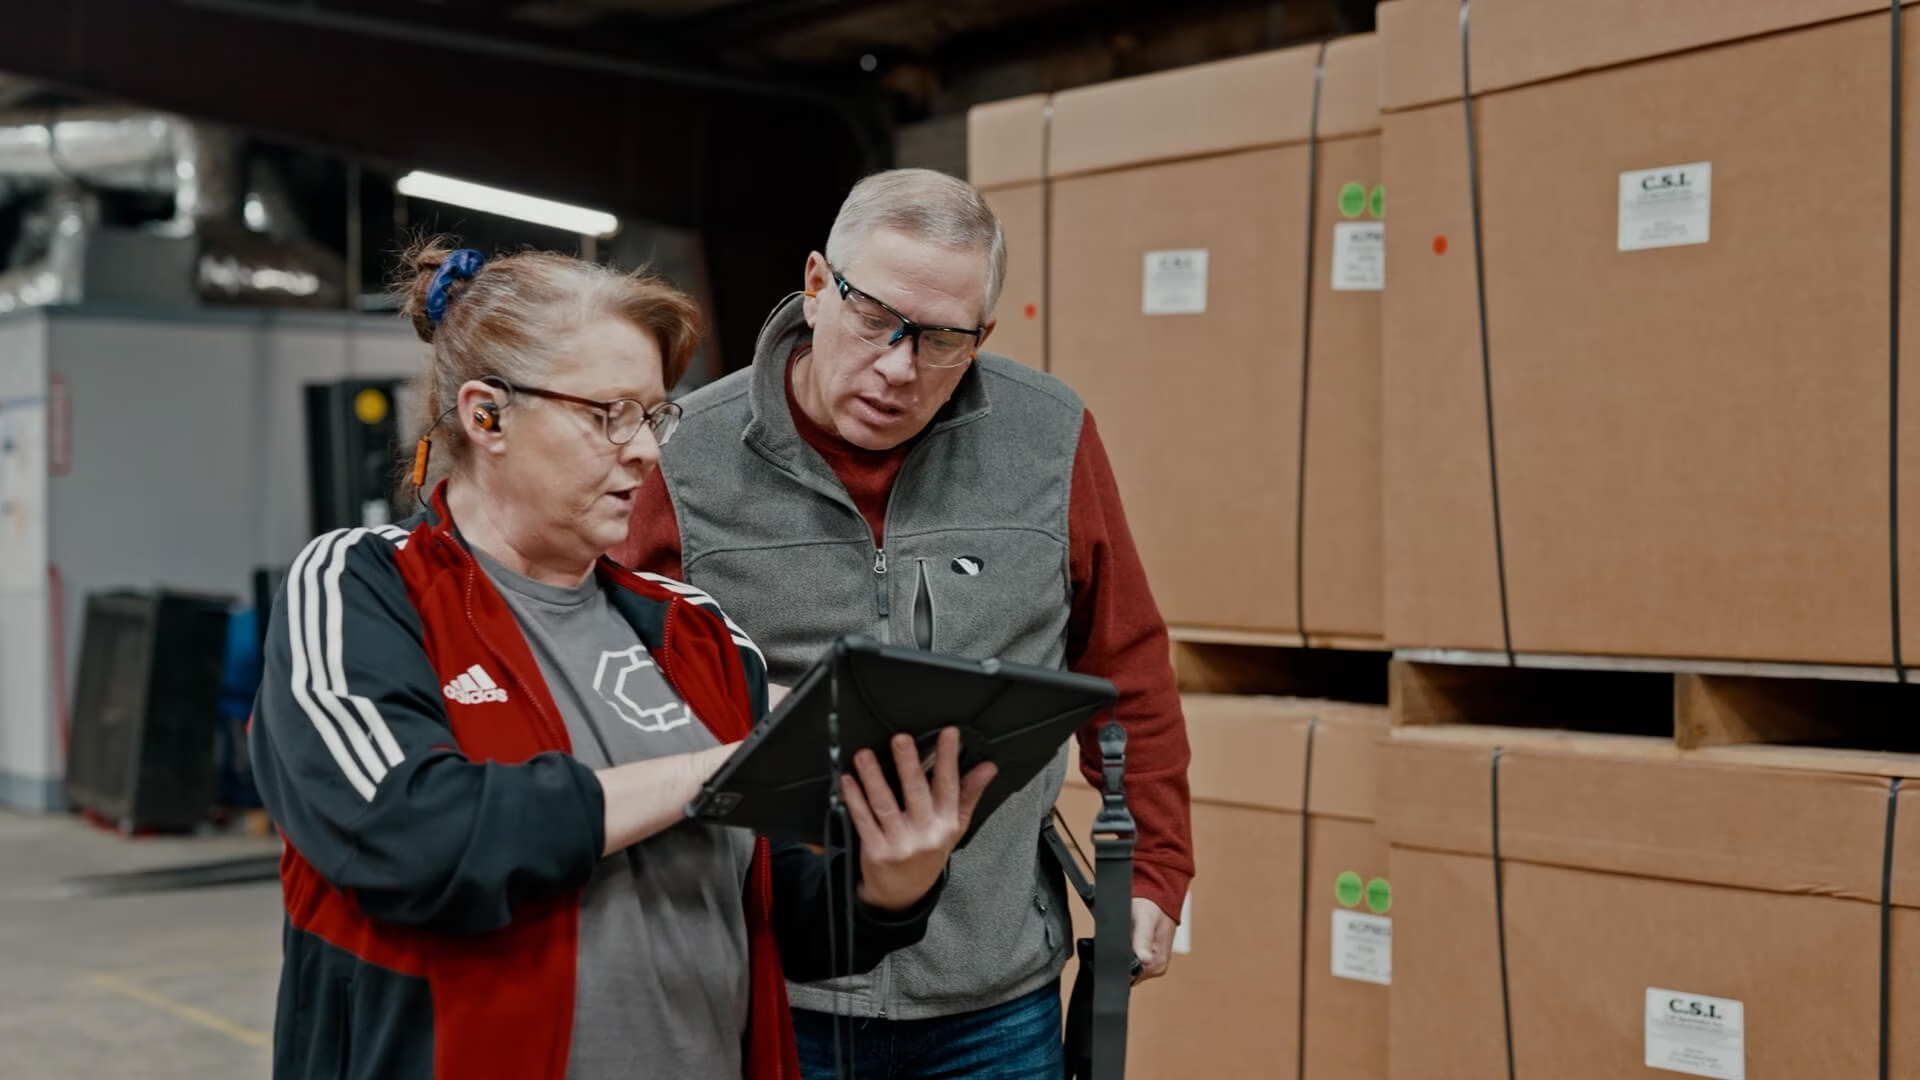
No formal training required: Redzone's user-friendly software means most operators are logging independently within their first shift.
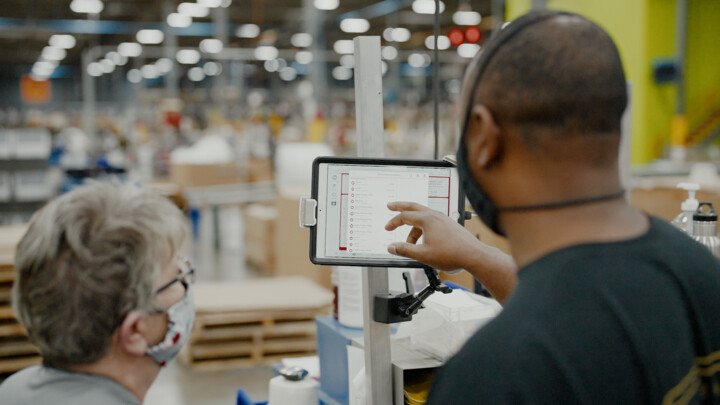
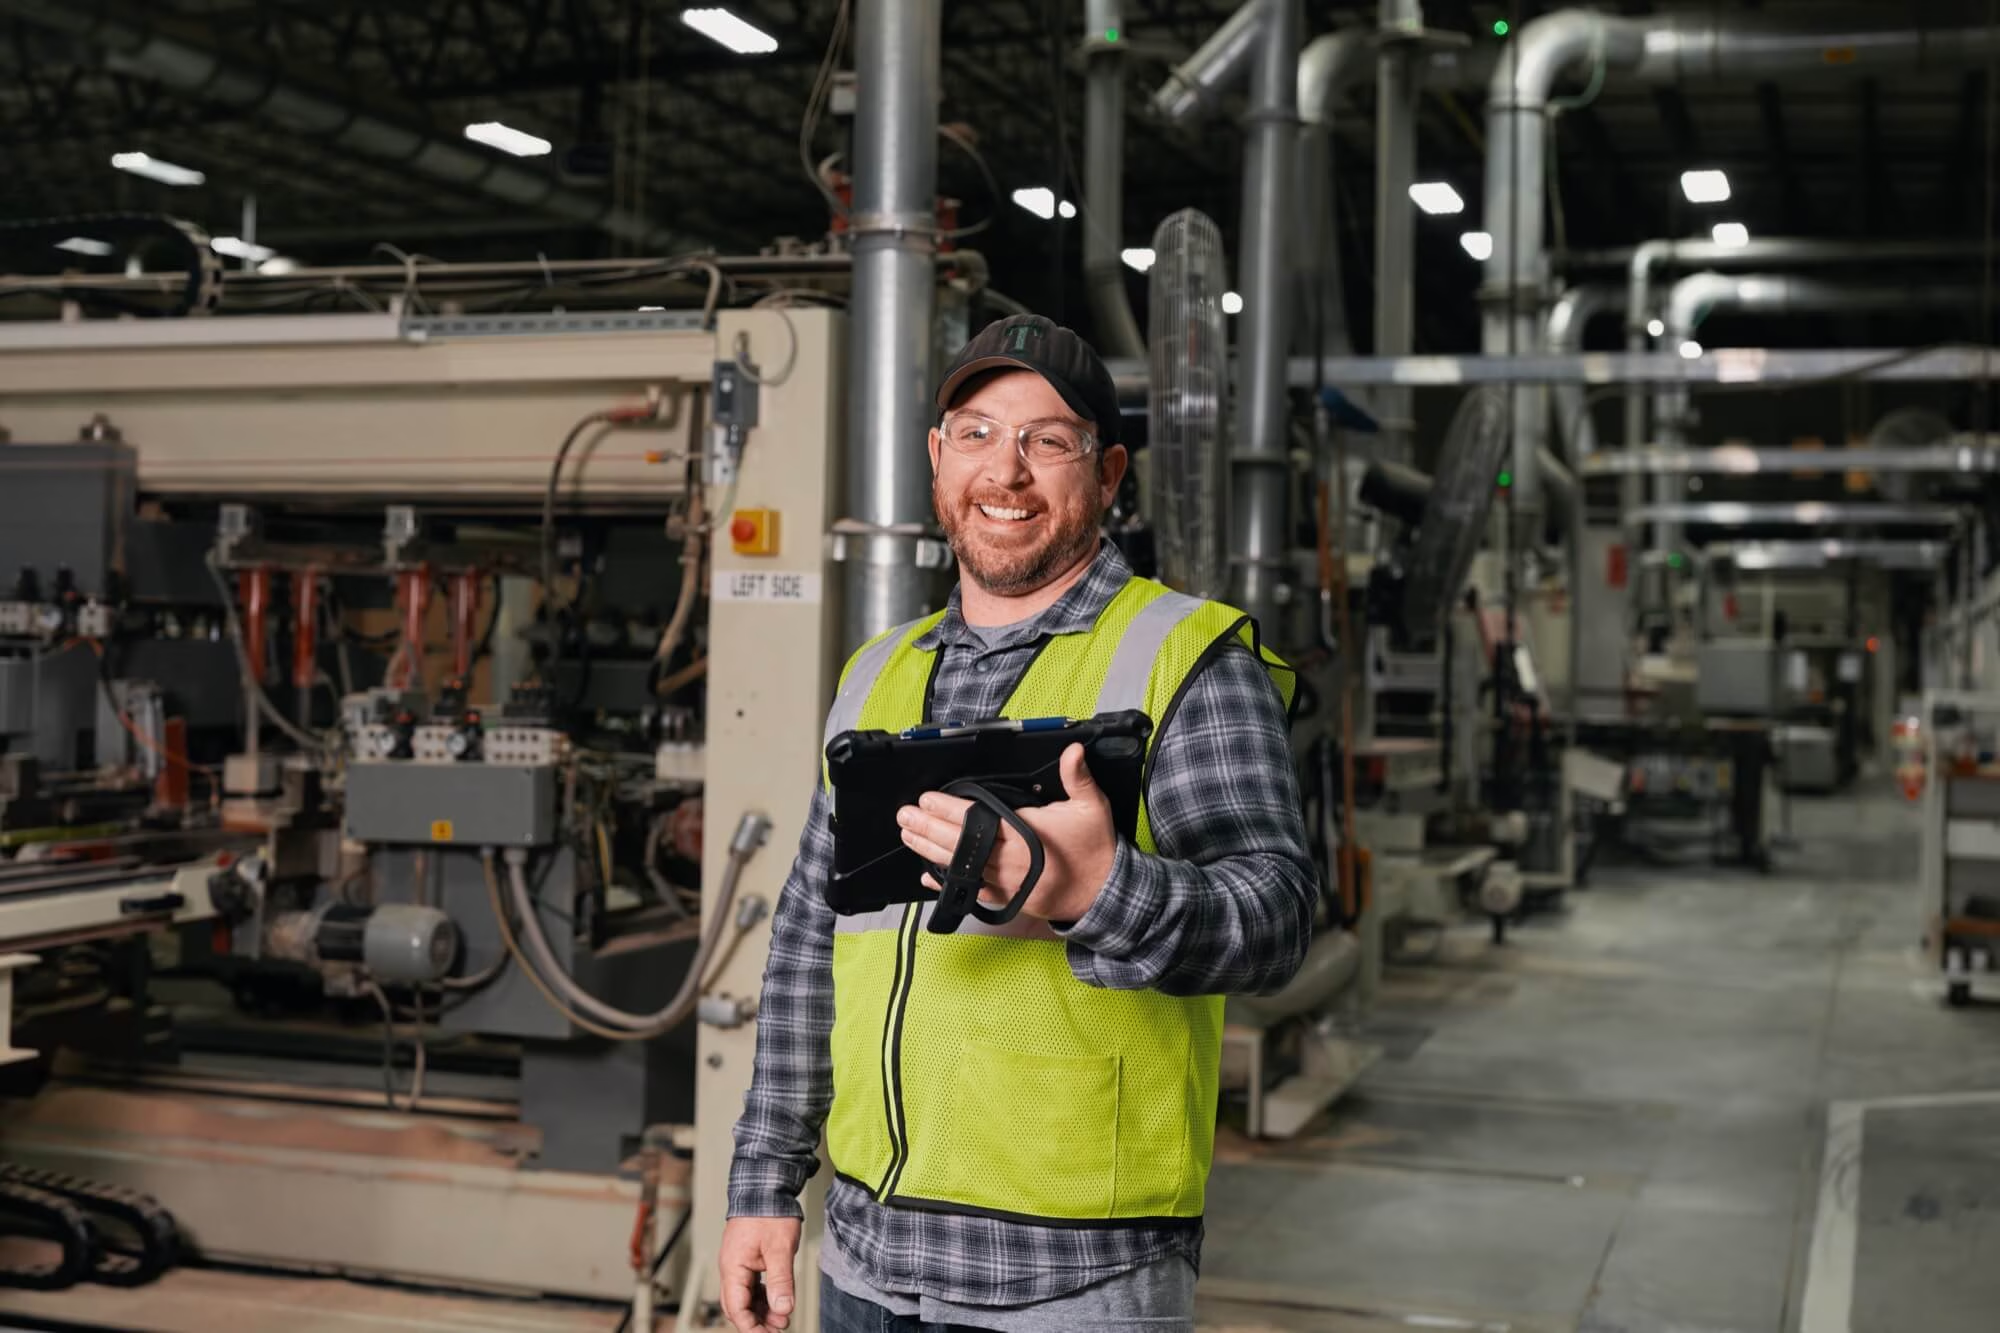
Operators log stoppages in seconds from a phone or tablet.
Supervisors see issues the moment they happen.
Maintenance is informed automatically, no manual notification chains.
Schedulers see and manage disruption before it impacts customers.
Redzone's user-friendly software means most operators are working in the app independently within their first shift.





.png)




.avif)
Frequently Asked Questions
Didn’t find what you need? View the full FAQ.
What is downtime tracking?
Downtime tracking is the practice of recording every production stoppage — when it happened, how long it lasted, and why. Real-time downtime tracking records an event as it happens, instead of reconstructing it from memory at the end of a shift, and software-driven tracking makes that happen automatically.
What is the average cost of downtime?
Downtime costs vary widely by industry, plant size, and how downtime is defined, so there's no single reliable industry-wide figure. The more useful number is your own: tracking stoppages by line lets you calculate what downtime really costs your plant.
How do you calculate production downtime?
Production downtime is the cumulative time a production line is stopped during a defined period. The “Availability” component of OEE for a given period is calculated by subtracting downtime from total planned production time, then dividing by total planned production time.Availability % = (Planned Production Time − Downtime) ÷ Planned Production Time
What are downtime reason codes?
Downtime reason codes are a standardized list of causes — like changeover, material shortage, or mechanical failure — used to classify each stoppage. This allows supervisors to analyze downtime data by category instead of manually grouping incidents.
How can manufacturers reduce unplanned downtime?
Manufacturers typically start by capturing every stoppage in real time with a reason code, tracking that data over time, and identifying trends. Then they use that data to find and fix the top recurring causes systematically instead of reacting to breakdowns one at a time.