Best OEE Software: How to Evaluate the Category


.webp)
published
September 29, 2026
Key Takeaways
The best OEE software depends on the loss costing your plant the most. Measurement, machine connectivity, custom workflows, and frontline follow-through each point to a different tool.
Ask every vendor what their software does in the 10 minutes after a line stops. That one question separates these tools faster than a feature checklist.
Trustworthy data comes before good-looking dashboards. A polished number nobody believes won't change anything on the next shift.
Read every rating and case study for scope. Check the review count and category on G2, Capterra, and Software Advice, and ask whether a quoted result came from one line, one plant, or a full rollout.
Across 1,500 plants that completed Redzone's 90-day deployment, average OEE climbed 12 points, from 47% to 59%. Plants that started furthest behind gained the most.
Every OEE software vendor promises a dashboard that finally makes your losses visible, and most can deliver. Putting a live number on a screen is a solved problem in 2026.
The harder part is the 10 minutes after a line stops. Someone has to notice, figure out why, decide what to do, and make sure the fix is still in place next week.
That stretch is where OEE tools diverge, and it's the lens this guide uses to compare them. We'll start with eight OEE applications worth a look, then give you some tools to do your own investigation: We'll explain how to read the review-site ratings most buyers start with, share seven questions to ask on every demo, and show what realistic improvement looks like.
What Is OEE Software?
OEE software tracks overall equipment effectiveness automatically, then digitizes that measurement so nobody has to rebuild it from clipboards at the end of the shift.
OEE software pulls production counts, downtime, and scrap from machines, sensors, or operator input and turns them into a live score by line, shift, and plant. The OEE score tells you where time went, but knowing what to do about it is where the savings come from. Two plants can run the same dashboard, and only one of them gets the downtime back.
The Best OEE Software in 2026
Here are eight OEE tools worth evaluating. Details reflect each vendor's public positioning, published case studies, and review-site data as of September 2026, so confirm specifics with vendors before you finalize a shortlist.
The table gives you a quick view, and we'll go deeper on each tool below.
Ratings as of September 2026, shown as the average score on a 5-point scale with the number of reviews in parentheses.
Redzone
Best for: Plants where the OEE number exists and the same losses keep coming back, especially when the causes trace to changeovers, setup, training, or shift handoffs. Redzone fits midmarket and enterprise plants in food and beverage, CPG, industrial manufacturing, and more.
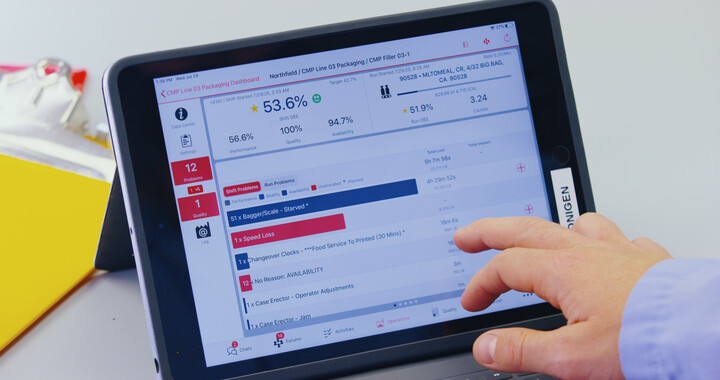
About: Redzone is the #1 Connected Workforce Solution for manufacturing, and OEE tracking in Redzone Productivity is one part of it. Operators see real-time line performance and tag each stop from a tablet at the line. From there, loss analysis moves into digital huddles, 5 Whys, and an action with an owner that's tracked until it closes. A downtime event, the maintenance work it triggers, and the training that follows all live in one record through Redzone Compliance, Redzone Reliability, and Redzone Learning, so the pattern behind a repeat stop shows up instead of hiding in three separate systems.
The biggest difference is people. Every deployment comes with coaches who have worked in plants themselves. They train teams on the floor and lead the first Kaizen events during a structured 90-day deployment. ChampionAI recommends next actions from a plant's own data, and your people make the calls. More than 2,000 plants run Redzone.
Published results: Redzone's 2025 Productivity Benchmark Report covers 1,500 plants that completed its standardized 90-day deployment between 2013 and 2024. Average OEE rose from 47% to 59%, and after 1,000 days it sat 24 points above where plants started.
What reviewers say: As of September 2026, Redzone holds a 4.9 out of 5 on Capterra (277 reviews) and Software Advice (285 reviews) and a 4.8 on G2 (630 reviews). Across all three, reviewers regularly single out their coaches by name.
Watch for: Redzone asks more of your organization than a measurement rollout. Supervisors run a daily huddle, operators enter honest stop reasons, and plants that treat it as a software install get far less out of it. Some G2 reviewers at smaller companies say the program feels built for larger operations.
{{callout1}}
Vorne XL
Best for: Plants that want visible accountability at the line with minimal IT involvement.
About: Vorne XL is a hardware appliance that puts live OEE on large scoreboards at the machine, so operators see performance without logging into anything. A single machine can be self-installed in hours. It's sold as a one-time purchase with no subscription, and Vorne offers a 90-day free trial.
Watch for: It runs on-premises, each machine's sensor inputs need wiring, and complex multipart cycles may need customization. Also ask who is accountable to that scoreboard and what they're expected to do when it turns red. A display nobody owns becomes wallpaper within a month.
Evocon
Best for: Small and midsize plants replacing manual tracking without a long implementation.
About: Evocon captures machine data automatically and has operators pick a stop reason from a touchscreen at the line, pairing what a sensor shows with what only a person knows. Setup takes hours, pricing is per machine, and Evocon offers a 30-day free trial.
Published results: Meat and food producer HKScan improved OEE on its packaging lines by an average of 20% over six months, then rolled Evocon out to more than 35 packaging lines across its Estonian and Latvian plants.
Watch for: Evocon is deliberately focused on measurement, so the daily conversation about the numbers happens outside it. Test the reason code list before you commit. A list that's too coarse produces clean dashboards nobody can act on.
MachineMetrics
Best for: Discrete and CNC shops with modern controls, where the gap is getting equipment to report at all.
About: MachineMetrics pulls data directly from machine controllers and programmable logic controllers (PLCs), categorizes downtime from machine signals, and layers MES-style production tracking on top. According to ABI Research, which ranked it second among up-and-coming OEE analytics vendors in 2025, MachineMetrics supports factory protocols including MTConnect, MQTT, and Modbus TCP and can integrate with more than 20,000 known sensors. ABI puts its average time to value at 30 to 60 days, with licensing based on machine count instead of user seats.
Published results: Walk-in van body manufacturer Morgan Olson moved from paper tracking to MachineMetrics at its Michigan plant and raised machine utilization by 20% within months, reaching 72%.
Watch for: Controller integration takes engineering time, and older controls may need retrofitting first. Ask for a reference customer running the same controls you do. Machine-reported stop codes also have limits. When a machine logs a generic stop and the real reason lives with the operator, you'll want a way to capture it.
Guidewheel
Best for: Mixed fleets of legacy and newer machines that need visibility within days.
About: Guidewheel's clip-on sensors read each machine's electrical current, so there's no PLC integration, and older equipment connects the same way new lines do. Text and email alerts flag stoppages as they happen, and the platform adds energy monitoring tied to production.
Watch for: Guidewheel describes itself as a visibility-and-action layer, so plants that want deep controller-level data may need more.
Tractian
Best for: Plants where most losses trace back to equipment health.
About: Tractian pairs OEE tracking with its own IoT sensors, condition monitoring, and CMMS. When availability drops, the platform ties the loss to the specific asset and the maintenance work behind it, which shortens the path from a stop to a work order.
Watch for: The emphasis is on the machine. If your biggest constraint is people and process, weigh how much of the platform your team will use.
TeepTrak
Best for: Multisite groups that want AI-assisted loss classification.
About: TeepTrak uses plug-and-play sensors that fit machines of any age and an AI engine called JEMBA that classifies each loss to a root cause. The company reports deployments in more than 450 factories across 30-plus countries.
Watch for: The platform centers on machine data and loss analysis, so teams that want structured frontline routines or coaching will need to build those around it.
Tulip
Best for: Plants with an automation or CI engineer who will own the build.
About: Tulip is a no-code frontline operations platform. OEE tracking is one app you assemble alongside work instructions, quality checks, and electronic batch records, so you can shape the tool around a process that doesn't look like anyone's template. That flexibility has made it popular in regulated industries like pharma and medical devices.
Published results: DMG MORI used Tulip's digital work instructions on the spindle assembly line at its Pfronten facility and reported a 20% production increase and a 62% reduction in reported defects.
Watch for: The flexibility assumes someone does the building. Ask who builds your first OEE app, how long it takes, and what happens to it when that person changes roles. Subscriptions are priced per interface with a 10-interface minimum.
How to Read OEE Software Ratings on G2, Capterra, and Software Advice
Most buyers build a shortlist like the one above by perusing review sites before they talk to a single vendor. That's a smart first step, as long as you know what each site measures.
Capterra
Capterra's Shortlist and "Best Of" badges are built from ratings and review volume within a category. Its review filters are the most useful part of the site. Sort by company size, industry, and reviewer role to find feedback from plants that look like yours.
G2
G2 places products on its Grid using verified user reviews, plotting customer satisfaction against market presence. Check a product's category before you compare scores. Plenty of strong OEE tools are filed under neighboring categories, like connected worker platforms, CMMS, or MES, so a tool missing from one category page may still belong on your list.
Software Advice
Software Advice, part of the same Gartner Digital Markets family as Capterra, publishes verified reviews with separate scores for ease of use, value, customer support, and functionality. When two tools share a similar overall rating, those subscores tell you more than the headline number.
What to Check on Any Review Site
Start with review count, since a 5.0 from 12 reviews says less than a 4.8 from 250. Look at recency next, because a product that changed owners or rebuilt its platform can look different than it did three years ago. Then filter for reviewers in your industry and at your company size, and read the three-star reviews. That's where users explain the tradeoffs.
One more habit worth building is checking who published any "best of" list you find through search. Many of the top-ranking OEE roundups are written by vendors, and several rank themselves first.
This guide is published by Redzone, which is why every tool description says who the tool fits best and where it falls short, Redzone included.
7 Questions to Ask Every OEE Software Vendor
When you've narrowed your list, these seven questions will tell you more in a demo than any feature list. Score every tool against these questions and write down the evidence as you go, so your team isn't comparing four demos from memory.
1. How does our data get into the software?
There are three common approaches to data ingestion, and many plants run a mix.
- Connecting to machine controllers or PLCs gives precise data but takes longer to roll out across older equipment.
- Clip-on sensors go live fast and treat a 30-year-old press the same as a new line.
- Operator input on a tablet captures what machines can't, like whether a stop was a jam on the feed or a changeover that ran long, but it depends on people entering it consistently.
Several platforms do two of these at once. Redzone and Evocon both pair automatic machine capture with operator tagging on a tablet, which is what turns a timestamp into a reason.
2. How long until we see the first trustworthy number?
Ask for a date instead of a range, then ask how the OEE score usually moves after that. Plenty of plants see OEE jump in the first week of a rollout and then sit flat for a year. The 90-day and 1,000-day numbers further down are a useful way to sanity-check whatever a vendor tells you here.
3. Who opens the app?
If the main user is a plant manager, you're buying visibility. If operators and supervisors use it at the line all shift, you're buying participation. Look for line-side displays and mobile access so that the operator and the supervisor can react to a stop together.
Redzone's guide to manufacturing dashboards covers what belongs on those screens.
4. What happens in the 10 minutes after a stop?
This is the sharpest question on the list, so ask the vendor to walk through it on a real customer's setup. Who gets alerted? How does the operator log the reason, and do the reason codes map to a common scale (e.g., the Six Big Losses of OEE), so the same problem gets the same name on every shift? Who owns the fix, and where is it tracked until it's closed?
Built-in huddles, root cause tools like 5 Whys, and action tracking are what move a plant from measuring OEE to improving it.
5. How does it handle a bottleneck?
Look at how the tool identifies your constraint and tracks target speed against real output on that line. A plant that improves everywhere except the bottleneck ships the same volume it did before.
6. Does it standardize across plants?
If you run more than one site, ask how a downtime reason code set at one plant reaches the others, and whether planned production time is defined the same way everywhere. Cross-plant comparisons fall apart without that.
7. What's the scope behind every quoted result?
A pilot line, a single plant, and a full rollout are three different claims. For any result a vendor shares, ask which lines, over what period, and from what starting OEE.
{{callout2}}
What Improvement Should You Expect in 90 Days?
An 85% OEE is considered "world class" but that number is irrelevant out of context. The more useful question is how far a line can move in its first quarter after it makes a change.
Redzone's 2025 Productivity Benchmark Report offers one of the larger datasets on that question: 1,500 plants that completed the same standardized 90-day deployment, combining real-time OEE tracking, coaching, and daily frontline routines.
Average OEE went from 47% to 59%. Where a plant starts shapes the result more than the average does.
- Plants with the lowest baseline and the least continuous improvement experience started near 37% OEE and saw the biggest jump, a 36.4% increase in 90 days.
- Plants with established CI programs saw smaller, steadier gains, since improvement builds on routines they already run.
- The first 90 days are the start of the curve. After 1,000 days, average OEE was 24 points above baseline.
Use these as a yardstick when any vendor, Redzone included, quotes a number. Ask what the starting OEE was, how many lines were involved, and how long was the measurement period.
How to Choose: Do You Need Measurement or Action?
Every tool on this list will give you an OEE number. What happens next is what decides the right fit. Run this test before you shortlist anyone. Pull your last 20 unplanned stops and sort them by true cause.
- If most are equipment failures and nobody agrees on the numbers, your problem is measurement.
- If you already have decent numbers and the same three lines keep stopping anyway, your problem is follow-through, and more measurement won't touch it.
If Your Numbers Are the Problem
Start with a measurement-first tool. Vorne XL and Evocon get a trustworthy number in front of people fastest. Guidewheel and TeepTrak suit mixed or older equipment, MachineMetrics fits CNC shops with modern controls, and Tractian makes sense when breakdowns drive most of your losses.
If Follow-Through Is the Problem
Look at where those repeat causes sit. Changeover technique, setup variation, and procedures nobody was trained on don't show up as equipment problems, and a measurement tool will record them accurately without changing any of them. Prioritize escalation, shift huddles, action tracking, and hands-on support for supervisors. This is the gap Redzone was built to close.
If Your Process Doesn't Fit a Template
If your operation is unusual enough that off-the-shelf workflows won't fit, and you have an engineer ready to own the build, a platform like Tulip lets you design the app around your process.
If You're Still Running OEE on Spreadsheets
Spreadsheets are the most common OEE tool in manufacturing, and they work until they don't. Three signs it's time to switch: the numbers show up a day late, each shift uses its own downtime reasons, and nobody on the floor trusts the math.
What No OEE Software Will Do for You
A few limits apply to every option on this list. No tool sets your standards, so someone still has to decide what "target speed" means on each machine. None of them fixes a staffing shortage. And none survives a plant where the frontline sees it as surveillance, because every one depends on operators giving honest stop reasons.
Why Redzone for OEE Software
Every tool on this list will tell you that a line stopped, and Redzone is built for the 10 minutes after. Operators work the loss with real-time OEE tracking at the line, and coaches who have run plants stay alongside supervisors through the 90-day deployment. Because quality, maintenance, and training run in the same Connected Workforce Solution, a fix made on first shift is still in place on third.
See how Redzone's Productivity software turns OEE data into daily wins on your floor.

Frequently Asked Questions
What is the best OEE software for manufacturers?
It depends on the loss costing your plant the most. Redzone fits plants where the number exists but the same losses keep repeating. It holds 4.9 ratings on Capterra and Software Advice. Vorne XL and Evocon suit plants that need a trustworthy number fast; MachineMetrics fits CNC shops; Guidewheel and TeepTrak suit mixed or older equipment; and Tulip works for teams that want to build custom apps.
What is a good OEE score?
85% is the widely used benchmark for world-class performance on a single line. Most plants start well below that. Across the 1,500 plants in Redzone's 2025 benchmark, the average starting OEE was 47%. A realistic target depends on your equipment, product mix, and how often you changeover on lines.
Does OEE software replace my ERP or MES?
No. OEE software works alongside both. Your ERP handles planning and transactions, and an MES manages orders, scheduling, and production records. OEE software focuses on what happens on the line and how your team responds to it. Many MES platforms include an OEE module, and many plants still run a dedicated OEE tool next to their MES.
How much does OEE software cost?
Pricing models vary widely. Some tools charge a subscription per machine, some sell hardware as a one-time purchase, and enterprise platforms like Redzone quote based on sites, lines, and modules. Budget for sensors, tablets or displays, and implementation support too.
How long does OEE software take to show results?
Hardware-led tools like Vorne XL can show a number within hours, and cloud tools like Evocon install in hours to days. Tools that also change frontline routines take longer to land and tend to show larger gains, with 90 days the common measurement window. Redzone structures its rollout around a 90-day deployment with on-site coaching.