The 15 Manufacturing KPIs Every Plant Manager Should Track


.webp)
published
September 29, 2026
Key Takeaways
Manufacturing KPIs fall into 5 categories: production, quality, maintenance, safety, and delivery and workforce. Tracking only one category leaves blind spots in the others.
Overall equipment effectiveness (OEE) is the single most important production KPI, since it combines availability, performance, and quality into one score.
Most plants don't need to track all 15 KPIs daily. Start with 3 to 5 tied to your current biggest constraint, then expand.
A KPI without an owner and a review cadence is ineffective. Every KPI on this list needs both.
Real-time, automated tracking catches a slipping metric while there's still time to fix it. Manual, end-of-shift tracking usually catches it too late.
Most plants end up tracking whatever KPI is tied to the loudest problem that week, which is how you get a list that's either too long to use or too narrow to catch other problems.
Here are the 15 manufacturing KPIs worth tracking, grouped into the 5 areas that run a plant: production, quality, maintenance, safety, and delivery and workforce.
Production KPIs
Production KPIs measure how much your plant makes, how fast, and how consistently, relative to what it's capable of.
1. Overall Equipment Effectiveness (OEE)
OEE combines availability, performance, and quality into a single percentage score that shows how much of your planned production time is productive. Most manufacturers score around 60% before they start tracking it; 85%, the benchmark Seiichi Nakajima set in his book Introduction to TPM: Total Productive Maintenance, is considered world-class. See Redzone's full OEE guide for the formula, benchmarks, and how to improve it.
2. Throughput
Throughput is the volume of product a line or plant produces in a given time period. It's the most direct measure of output, but it only tells half the story without quality and cost context, which is why it's rarely tracked alone.
3. Cycle Time
Cycle time is the total time it takes to produce one unit from start to finish. Rising cycle time could be an early signal of equipment wear, an untrained operator, or a bottleneck forming upstream.
Quality KPIs
Quality KPIs catch defects and rework before they turn into scrapped material, customer complaints, or a recall.
4. First Pass Yield (FPY)
First pass yield is the percentage of units produced correctly the first time, without rework or scrap. It's calculated as good units divided by total units started. A falling FPY is often the first sign of a problem, well before it shows up in customer complaints.
5. Scrap and Defect Rate
Scrap and defect rate tracks the percentage of production that fails to meet spec and can't be reworked. Pairing this metric with a Pareto chart of defect causes shows which few defect types drive most of the loss, so improvement efforts target the right problem first.
6. Cost of Quality
Cost of quality adds up what defects cost: scrap, rework, warranty claims, and the inspection and prevention work meant to catch problems earlier. It's the metric that turns a quality issue into a number a plant manager can defend in a budget conversation.
{{callout1}}
Maintenance KPI
A maintenance KPI measures how well a plant prevents equipment failure, rather than how it reacts after a failure happens. Maintenance KPIs show whether repair and upkeep work is planned and proactive, or whether it's mostly emergency response after something breaks down.
7. Mean Time Between Failures (MTBF)
MTBF measures the average operating time between one equipment failure and the next. A rising MTBF means equipment is getting more reliable; a falling one is an early warning that a machine needs attention before it causes unplanned downtime.
8. Mean Time to Repair (MTTR)
MTTR is the average time it takes to diagnose and fix a failure. Long MTTR often points to a parts availability problem, an unclear repair procedure, or a skills gap on the maintenance team; Redzone's guide to equipment reliability breaks down how reliability and availability work together.
9. Planned Maintenance Percentage (PMP)
Planned maintenance percentage is the share of maintenance hours spent on scheduled work versus emergency repairs. A high PMP is one of the clearest signs a plant has shifted from reactive to proactive maintenance, and it tends to move MTBF and MTTR in the right direction at the same time.
Safety KPIs
Safety KPIs matter on their own terms, and they also tend to move with the same operational discipline that improves everything else on this list.
10. Total Recordable Incident Rate (TRIR)
TRIR standardizes recordable injuries per 100 full-time workers per year, using the OSHA formula (number of recordable incidents × 200,000, divided by total hours worked). It's the industry-standard safety benchmark, which makes it the number most useful for comparing your plant against others in your sector.
11. Near-Miss Reporting Rate
Near-miss reporting rate tracks how often close calls get reported before they become actual incidents. Counterintuitively, a rising near-miss rate is usually good news: it means workers trust the reporting process enough to use it, which surfaces hazards while they're still preventable.
12. Safety Training Compliance Rate
This tracks the percentage of employees current on required safety training. It's a leading indicator rather than a lagging one: a training gap today is a likely incident or compliance violation tomorrow.
{{callout2}}
Delivery and Workforce KPIs
These KPIs connect what happens on the floor to whether customer commitments and labor budgets hold.
13. On-Time Delivery Rate
On-time delivery rate is the percentage of orders that arrive by the date promised. It's the metric customers feel most directly, and it's usually a downstream symptom of problems elsewhere on this list: low OEE, high scrap, or unplanned downtime all show up here eventually.
14. Inventory Turnover
Inventory turnover measures how many times inventory is sold and replaced over a period, calculated as cost of goods sold divided by average inventory value. Low turnover ties up cash in material that isn't moving; high turnover with stockouts signals the opposite problem.
15. Labor Productivity
Labor productivity measures output per labor hour worked. It's easy to misread in isolation, since a low score can mean an efficiency problem or a plant that's appropriately staffed for a complex product mix. Track it alongside manufacturing dashboards that show real-time context, not just the raw number.
How Many KPIs Should You Track?
Tracking all 15 KPIs daily, for every line, is how a KPI program collapses under its own weight within a quarter. Most plants get more value starting with 3 to 5 tied directly to the current biggest constraint, whether that's downtime, scrap, or on-time delivery, and expanding from there once those are under control.
Every KPI on this list needs an owner and a review cadence, or it's just a number nobody acts on. Production and safety KPIs typically warrant daily review; quality and maintenance KPIs often work on a weekly cadence; delivery and workforce KPIs are frequently reviewed monthly, tied to broader planning cycles.
Why Redzone for Tracking Manufacturing KPIs
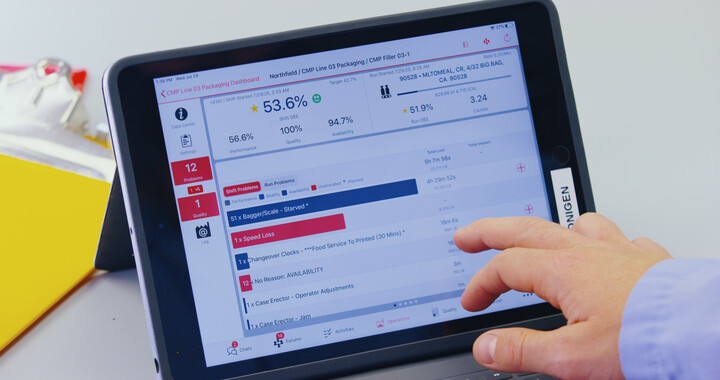
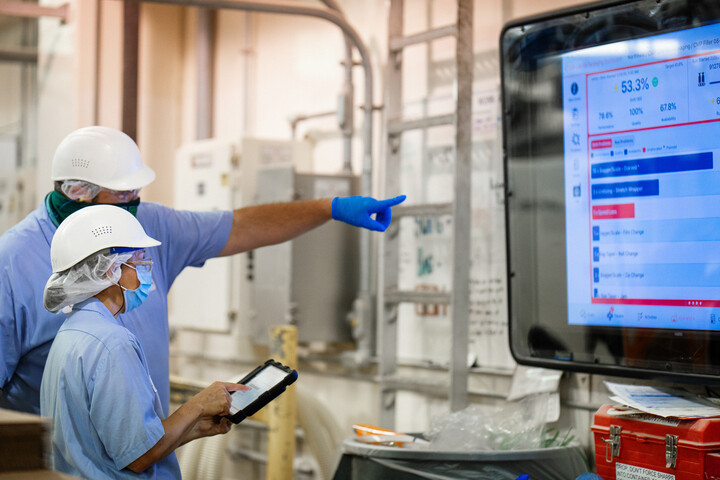
A KPI helps only if someone sees it before it becomes a problem, and most plants still find out from a report that's already a day old. Redzone surfaces OEE, downtime, and the KPIs that matter most in real time, right on the floor, so operators and leaders see the same number at the same moment. That's the difference between a dashboard nobody opens and one that changes what happens on the next shift.
See your KPIs update in real time with Redzone's Productivity software.

Frequently Asked Questions
What are the 5 KPIs for manufacturing?
The 5 KPI categories that matter most in manufacturing are production, quality, maintenance, safety, and delivery and workforce. Within those, OEE, first pass yield, MTBF, TRIR, and on-time delivery rate are the most commonly tracked single metrics.
What are some common KPIs used in production?
The most common production KPIs are overall equipment effectiveness (OEE), throughput, and cycle time. These 3 together show how much a line is producing, how fast, and how consistently, relative to its capacity.
What are the 4 KPIs every manager has to use?
There's no single fixed set of 4, but plant managers most consistently rely on OEE, first pass yield, MTBF or MTTR, and on-time delivery rate, since each represents a different area: production, quality, maintenance, and customer commitments.
What KPIs should a manufacturing dashboard track?
A manufacturing dashboard should surface KPIs across all 5 categories, production, quality, maintenance, safety, and delivery and workforce, rather than just one. Real-time OEE and downtime are typically front and center, since they update most frequently and drive the most immediate action.
How often should manufacturing KPIs be reviewed?
Review cadence depends on the KPI: production and safety metrics are usually reviewed daily, quality and maintenance metrics weekly, and delivery or workforce metrics monthly alongside broader planning cycles.