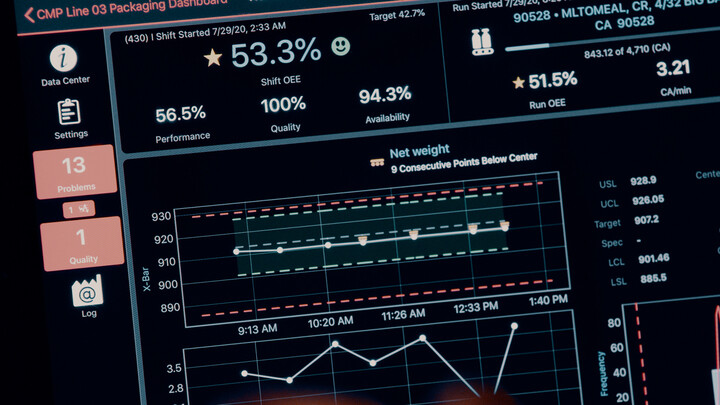
Can You Trust Your OEE Numbers? An OEE Data Accuracy Checklist




published
November 18, 2026
Key Takeaways
OEE multiplies availability, performance, and quality. Software builds those three factors from five records: the production schedule, production counts, downtime events, target speeds, and quality results.
Every record must cover the same line, hours, and product run. A calendar-day count paired with shift-level downtime produces a score that describes no real period.
Hours left out of planned production time, unplanned stops coded as planned, outdated target speeds, duplicated counts, and rework counted as good all make a shift look better than it was.
When a record disagrees with what happened on the line, correct the record and keep the original. Never edit the OEE percentage or a target speed to change the result.
Records that agree can still be wrong together. Test your standards on the floor with timed production studies.
Can You Trust Your OEE Numbers? An OEE Data Accuracy Checklist
Most plants measure themselves against 85%, the figure Seiichi Nakajima's work on total productive maintenance established as world class for discrete manufacturing. A line reporting 90% is above it. The comparison only means something if the score comes from consistent records.
An overall equipment effectiveness (OEE) score goes on the board, into the weekly report, and into staffing, maintenance, and capital decisions. OEE is calculated from records, not from the line itself. When a counter reset duplicates units, or a target speed set three years ago sits below what the line runs today, the score rises while the line runs exactly as it did before. OEE data accuracy means the records behind the calculation all describe the same production run, and every number traces to a record you can show.
This article explains where OEE calculations go wrong and gives you a six-step checklist to validate each record before you act on the score.
How Does OEE Software Calculate Your Score?
OEE software multiplies three factors: Availability × Performance × Quality.
- Availability is run time divided by planned production time.
- Performance compares what the line made with what it should have made at target speed during its run time.
- Quality is good units divided by total units. Under the standard definition, a good unit passes the first time, with no rework.
Those three factors come from five separate records. Each one comes from a different system, often kept by a different team: planners own the schedule, machines generate the counts, operators log downtime, engineering sets target speeds, and quality assurance inspects units. Nothing forces those records to cover the same hours or agree with each other, which is where errors start.
Why Are OEE Calculations Often Wrong?
OEE software calculates whatever it receives, and most common input errors push the score up. Either a loss drops out of the calculation, or the line gets credit for output it never made. That is how a line can report a healthy score even in a week it missed shipments.
Short stops work differently from the other errors. They barely change the total score, but they change where the loss shows up. A packaging line that stops 90 times in one shift, for an average of 20 seconds each, loses 30 minutes of production. If those stops are shorter than the minimum stop length your system logs, they vanish from the downtime record, and the lost output looks like slow running.
Your team then spends a month chasing a speed problem when the cause is dozens of short stops. See how to find the losses standard reports miss.
How Do You Validate OEE Data Before You Act on It?
Run this checklist to validate that your OEE number is true to what happens on the floor. It's written for the person who reports that number, usually the plant manager or continuous improvement lead. Bring operators and supervisors in early, because they were on the line and know what the records leave out. Hand a problem to your technical team when the cause is a system connection or a software setting. A faulty sensor feed and a rule that decides which stops count as planned both belong there.
Most shifts need only a quick check for exceptions, such as unknown downtime codes, counts that don't match the packaging total, or a score that jumped. Do it before the shift ends, while operators still remember each stop. Run all six steps before weekly or monthly decisions, such as a staffing change or an improvement project you want to fund.
Step 1: Confirm the Operating Period
- Check: The exact start and end of the period, the line, and the product run.
- Compare against: The timestamps on every record you plan to pull.
- Watch for: A calendar-day production total next to shift-level downtime. One covers 24 hours and the other eight, so they can't go into the same calculation.
- Fix: Pull both records again for the same window. Decide in writing how to treat shift changes, meal breaks, and sanitation.
Step 2: Validate Planned Production Time
- Check: The hours the schedule committed the line to run.
- Compare against: The published schedule and the shift calendar.
- Watch for: Overtime added after the schedule went out, cancelled runs, and an eight-hour shift showing six planned hours with no record of the other two. Removing time that should count, such as a run cancelled for a material shortage, shrinks planned production time and raises the score while output stays the same.
- Fix: Write down which time is excluded from planned production and apply that list every shift. Decide how to treat canceled runs: one caused by a material shortage is a loss, and deleting it from the schedule hides the loss.
Step 3: Validate Production Counts
- Check: The good-unit and total-unit counts for the period.
- Compare against: A record produced outside the OEE system, such as a packaging record, pallet count, or shipped-case total. Check good units against that record, and check total units against the packaging count plus the rejects logged at inspection.
- Watch for: Counter resets and duplicate transactions first, then manual entries and rework records.
- Fix: Change a count only when a record confirms the correct value. Keep both originals, and log the reason, owner, approval, and time.
Here is how a mismatch looks on a packaging line. The system reports 10,000 total units and 120 rejects, so it shows 9,880 good units. The packaging record shows 9,680. The counter history shows a reset near the shift change that counted 200 units twice. Rejects are logged separately at inspection, so the reject count stayed correct, while the total and the good count (total minus rejects) both rose by 200.
The quality rate stays at about 98.8% before and after the fix. The duplicated units overstated performance by about 2%, because the line got credit for output it never made. Knowing which factor an error lands on tells you where to look first.
Step 4: Review Downtime Records
- Check: Each event's start time, duration, and reason.
- Compare against: Machine signals, maintenance work orders, and operator notes for the same equipment and period.
- Watch for: Overlapping events, periods with no reason code, and repeated "unknown" entries. Unplanned stops coded as "planned" inflate the score, and planned stops logged as "losses" deflate it. Also check your minimum stop length: stops shorter than it never reach the downtime record.
- Fix: Replace unknown codes with specific causes while the shift still remembers them. Apply the same planned and unplanned definitions on every shift, and use a root cause analysis method on recurring events. For loss categories, see the guide to downtime tracking.
Step 5: Verify Target Speeds
- Check: The target speed the performance calculation used for this product on this line.
- Compare against: Your approved operating standard, the document that records the rate, the unit, and the date it took effect.
- Watch for: A unit mismatch, such as a per-hour rate feeding a per-minute calculation, and a standard set from a slow trial run that nobody revisited. Performance above 100% usually means the target speed on file is too low, or counts are duplicated.
- Fix: Reset the standard through your approval process when the line has demonstrated a different rate. Never edit a target speed to improve the score. The guide to cycle time explains how teams set the rate behind performance.
Step 6: Reconcile Quality Inputs
- Check: Total units equal good units plus rejected units for the period, with each unit in only one category.
- Compare against: Your documented rules for scrap, rework (units repaired and sent back out), startup waste (material lost before the line runs stable), and samples.
- Watch for: A reworked unit counted once as a reject and again as a good unit, startup waste left out of the total, and a quality hold released days later that lands in the wrong period.
- Fix: Count a unit as good only if it passed the first time, and record rework as a quality loss. Assign a late quality decision to the original production period. The guide to cost of quality shows how scrap and rework carry through to cost.
What Can Validation Tell You, and What Can't It?
A validated score gives your team evidence for choosing improvement priorities, because every metric traces to a defined source and period. Teams can act while shift details are fresh, instead of debating a figure from two weeks ago.
Validation can't prove your standards are right. A miswired sensor that feeds both the machine counter and the OEE system produces two records that agree and one score that is wrong. An approved target speed can also drift from how the line runs today.
Test those assumptions on the floor with periodic observation and timed production studies. In a timed study, someone watches a run under controlled conditions and records what the line does.
{{callout1}}
Why Redzone for OEE Data Accuracy?
Redzone's Connected Workforce Solution puts live OEE in front of the operators and supervisors who were on the line, so they record the reason for a stop during the shift. The schedule, the counts, the downtime, and the quality results live in one system, which closes the gap between five records owned by five teams. A Redzone coach works with your team on what the number is telling them and what to change on the next run.
Book a demo to see how your plant would trace an OEE score back to the records behind it.

Frequently Asked Questions
Is 90% OEE good?
Yes, if the inputs are accurate. An OEE of 85% is widely cited as world class, a benchmark that traces to Seiichi Nakajima's total productive maintenance work (QAD). A line reporting 90% or more is above that benchmark. The 85% figure comes from discrete manufacturing, so it isn't a fair target for every process. Lines with frequent changeovers or required sanitation often score lower and can still be well run. If the line's equipment and process haven't changed, check planned production time, the target speed on file, and short stops before you report the number.
Why do manufacturers overestimate their OEE?
Because most input errors either remove a loss from the calculation or credit the line with output it never made. The usual causes are excluding schedule time, miscoded stops, outdated target speeds, duplicated counts, and rework counted as good. A high score is only as reliable as the records supporting it.
How often should I validate OEE data?
Check exceptions during each shift, while operators still remember what happened. Run the full six-step validation before weekly or monthly decisions, and again after a product change, counter maintenance, a software update, or a target-speed revision.
What should I do when two records still disagree?
Keep both records, document the difference with an owner and a date, and flag the metric as under review until it is resolved. Send it to your technical team when the cause is a system connection or a software setting that controls the calculation. Examples include a faulty sensor feed or a setting that decides which stops count as planned.
Should I count rework as good production?
Not in the OEE quality calculation. The standard definition counts a unit as good only if it passed the first time, so a reworked unit is a quality loss even if it ships. If your plant also tracks final yield, report it separately and label it.